- CloudWatch provides metrics for every service in AWS.
- Dimension is an attribute (instance id, env, etc.) of a metric (30 dimensions per metric)
- Metrics hae timestams.
- Can create CloudWatch dashboards of metrics.
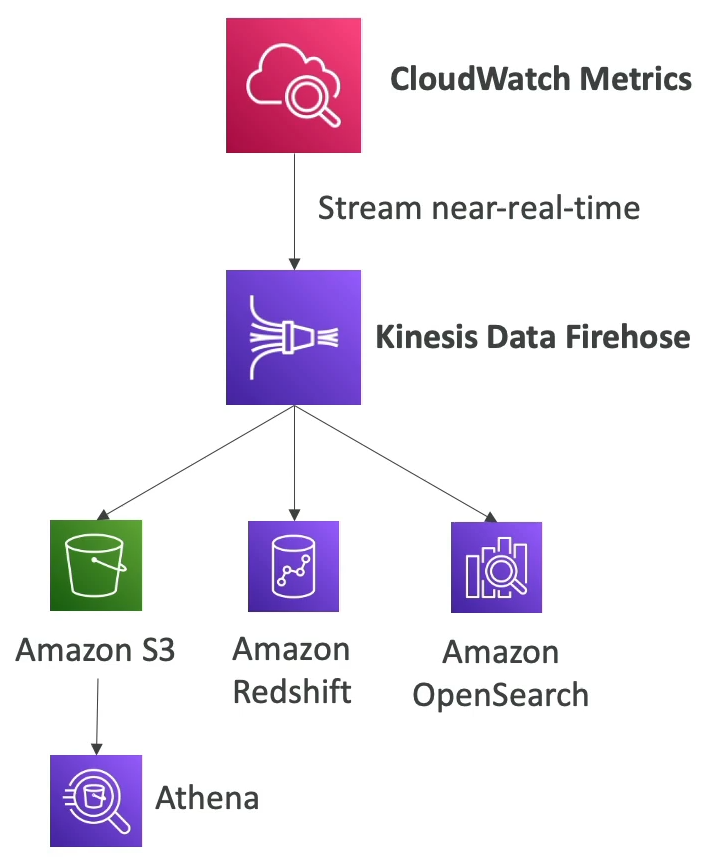
Metric Streams
Logs
- Log Groups, Log Stream
- Can define expiration policies.
- Encryption by default
- Can setup KMS based encryption with own keys.
Sources
- SDK, Elastic Beanstalk
- ECS, AWS Lambda, PC Flow Logs, API Gateway, Route 53
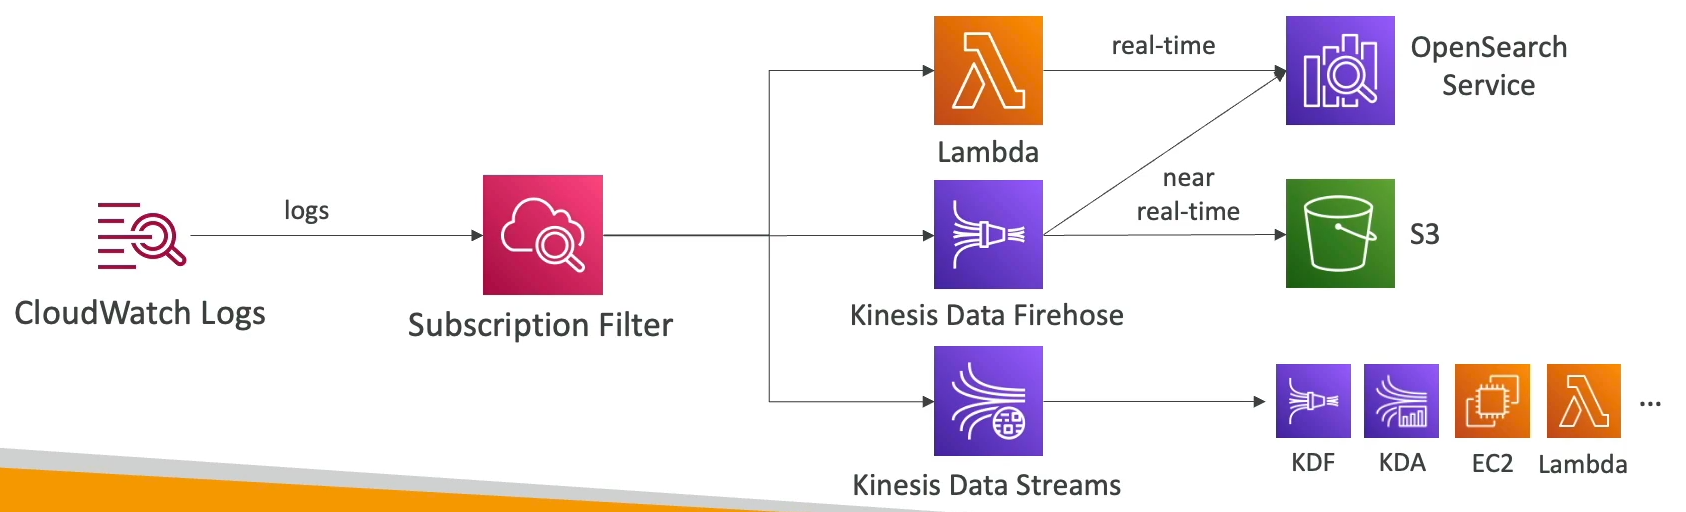
Logs Subscriptions
Logs for EC2
- By default no logs go from EC2 to CloudWatch.
- Need to run CloudWatch agent to push log files.
- Make sure IAM permissions are correct.
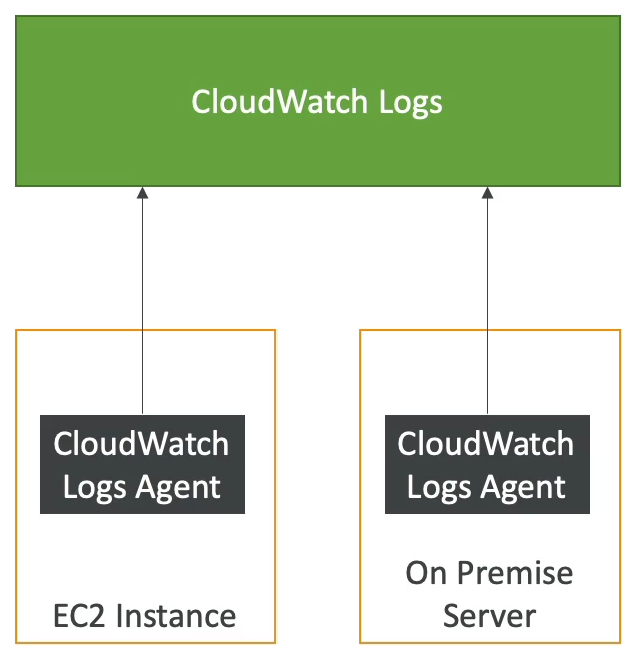
Agent
- CloudWatch Logs Agent: Only send to CloudWatch Logs
- CloudWatch Unified Agent: Collection additional system-level metrics such as RAM, processes etc.
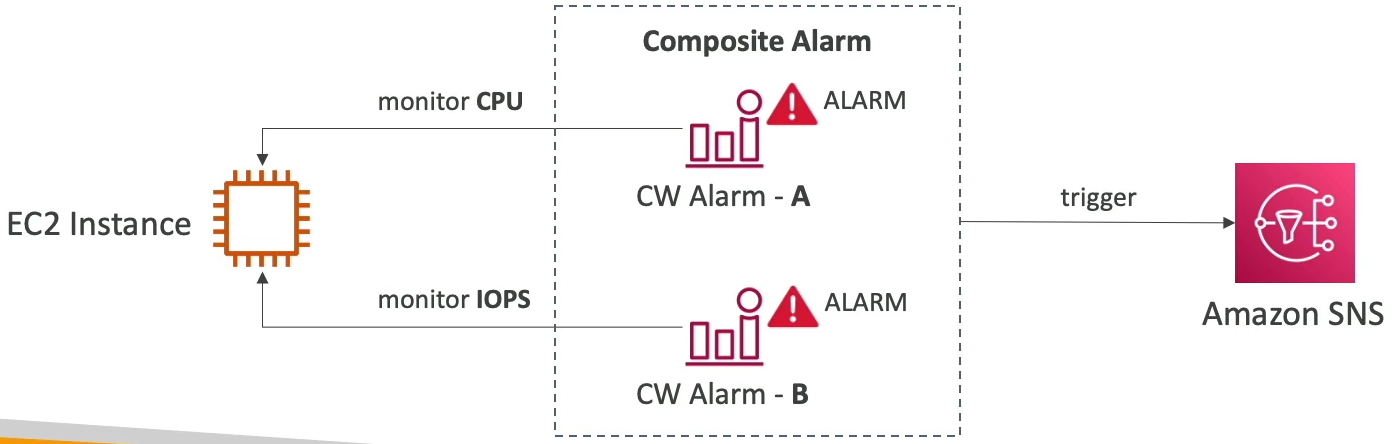
Alarms
- Trigger notification for any metric.
- Alarm States:
OK, INSUFFICIENT_DATA, ALARM
Targets
- Actions on EC2 instances, Auto Scaling Action, Send notification to SNS.
Composite Alarms
- Monitoring states of multiple other alarms.
CloudWatch Container Insights
- ECS, EKS, Kubernetes on EC2, Fargate, needs agent for Kubernetes.
- Metrics and logs
CloudWatch Lambda Insights
- Detailed metrics to troubleshoot serverless applications
CloudWatch Contributors Insights
- Find “Top-N” Contributors through CloudWatch Logs
CloudWatch Application Insights
- Automatic dashboard to troubleshoot your application and related AWS service.